View descriptive statistics via plot
descplot.RdApplies descdata to the selected columns and produces a plot showing the descriptive statistics. The plot is generated using ggplot2 and a suitable melt function.
Usage
descplot(data, cols = NULL, stats = 1:9, first = "variables",
         ncol = NULL, num_xaxis = "log", verbose = FALSE)
Arguments
- data
A data frame containing numeric columns to describe.
- cols
Column indices or names of numeric variables. If
NULL, all numeric columns are used.- stats
Statistics to plot, as in
descdata.- first
Name for the variable identifier column (passed to
descdata).- ncol
Number of columns in the facet layout (passed to
facet_wrap).- num_xaxis
How to treat numeric column names on the x-axis. Options:
"log"(default): if all selected column names are numeric, convert to numeric and use log10 scale;"numeric": convert to numeric but use linear scale;"character","factor","keep", orFALSE: keep as character/factor (no conversion).- verbose
Logical; if
TRUE, prints timing message.
Details
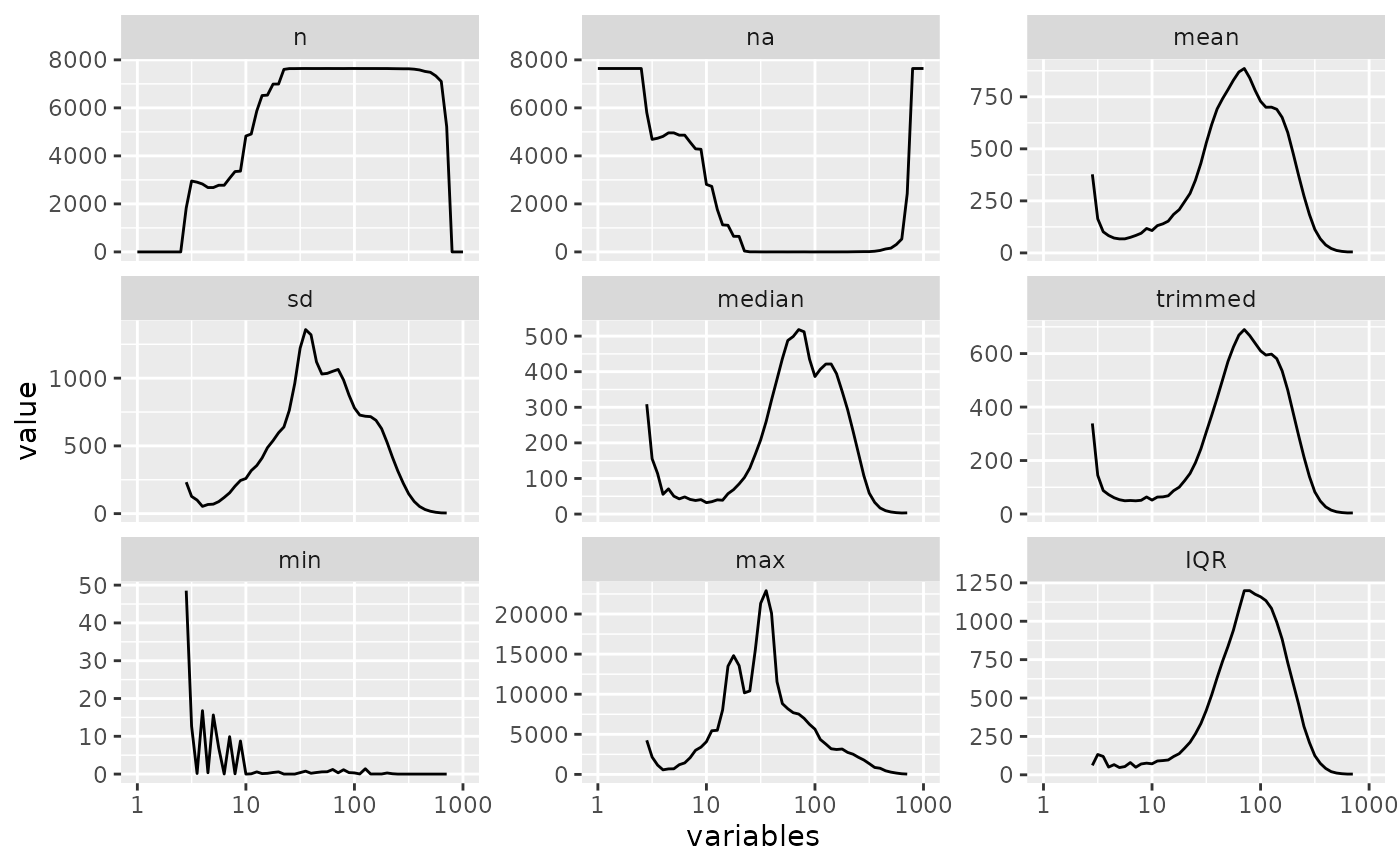
This function first calls descdata and then melts the result into a long format suitable for ggplot2. If the column names of the original data are numeric, the plot uses a logarithmic x-axis and line geometry; otherwise, a bar plot is produced. The num_xaxis parameter allows overriding the default log transform.
References
1. Example data is from https://smear.avaa.csc.fi/download. It includes particle number concentrations in SMEAR I Varrio forest. 2. Wickham, H. 2016. ggplot2: elegant graphics for data analysis. Springer-Verlag New York.
Examples
descplot(data, cols = 5:65)
#> Warning: Removed 84 rows containing missing values or values outside the scale range
#> (`geom_line()`).
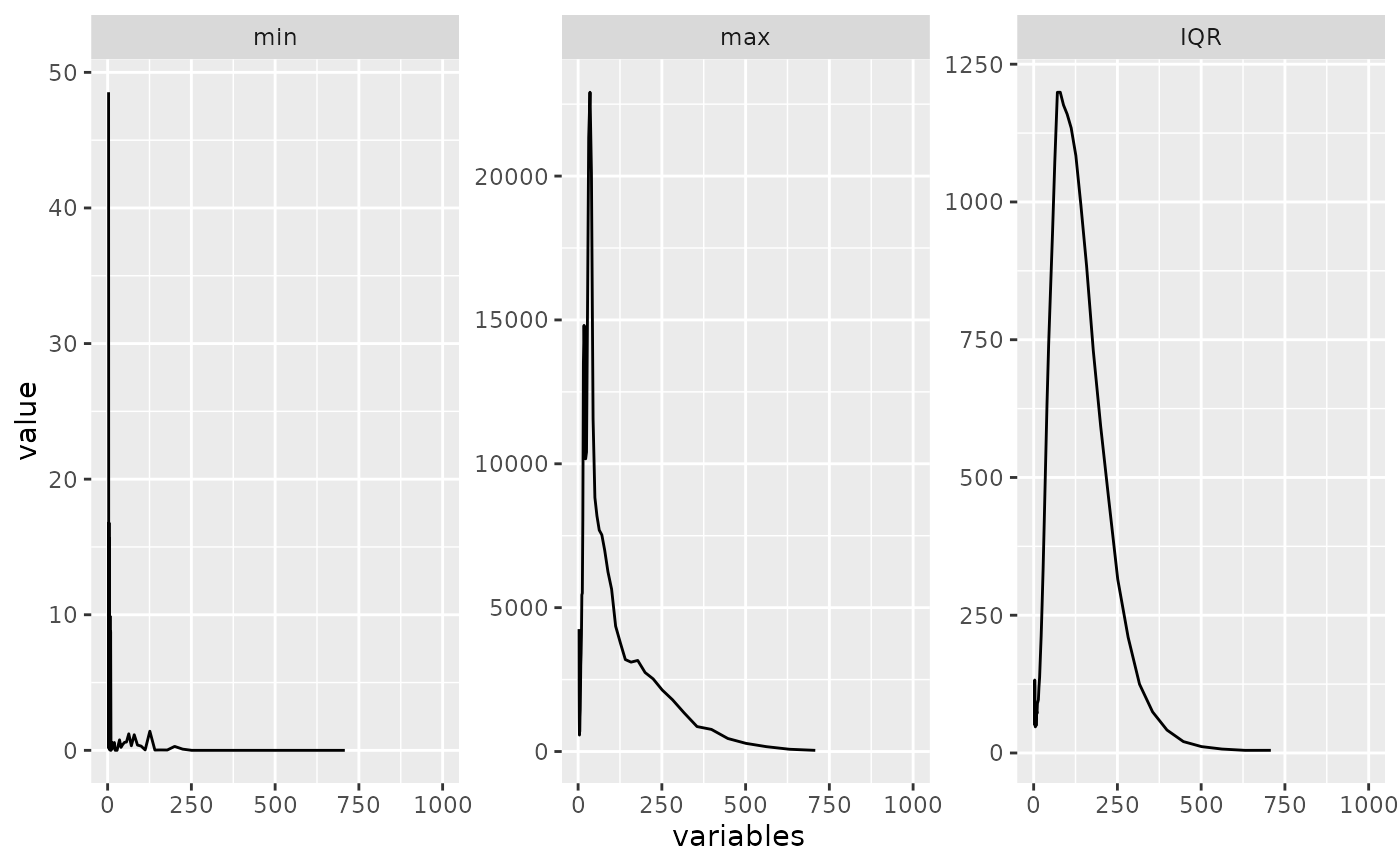
 descplot(data, cols = 5:65, stats = c("min","max","IQR"), num_xaxis = "numeric")
#> Warning: Removed 36 rows containing missing values or values outside the scale range
#> (`geom_line()`).
descplot(data, cols = 5:65, stats = c("min","max","IQR"), num_xaxis = "numeric")
#> Warning: Removed 36 rows containing missing values or values outside the scale range
#> (`geom_line()`).